

Using the Reports Dashboard
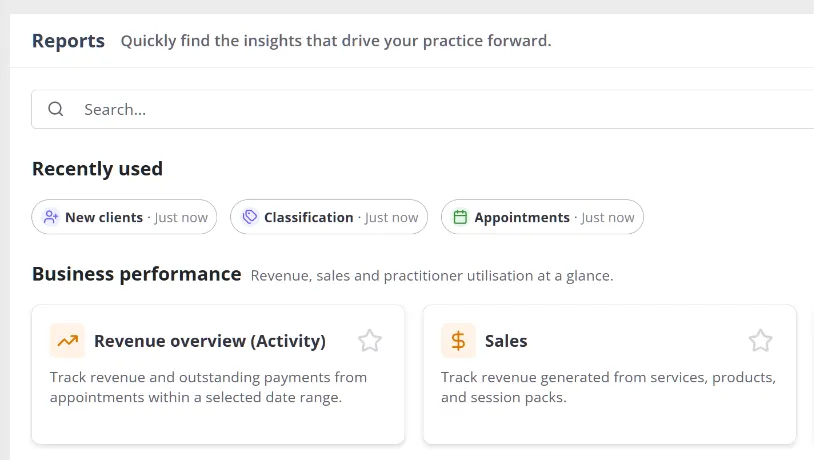
The Reports Dashboard is your main place to find, open, and return to reports in Zanda. It replaces browsing through a long reports menu with a simpler dashboard that groups reports into clear categories and adds tools to help you get back to the reports you use most.
Tip: From the Reports Dashboard you can browse reports by category, search by report name or description, star reports you use often, and reopen recently used reports faster.
What the Reports Dashboard does
The Reports Dashboard gives you a single, visual entry point for reports. Each report appears as a card with its name, description, and icon, making it easier to understand what a report does before you open it.
Reports are organized into business-focused categories such as Business performance, Client insights, and Financial performance. If you use some reports more often than others, the dashboard also helps you personalize the experience with Starred and Recently used sections.
Tip: Instead of remembering where a report lives in a navigation menu, you can discover it visually, search for it quickly, and keep important reports close at hand.
Why you would use the Reports Dashboard
- Find reports faster without opening multiple menu levels.
- Search across report names and descriptions from one place.
- Keep frequently used reports in a personal Starred section.
- Jump back into reports you opened recently.
- See only the reports available to you based on your access.
This is especially useful if you switch between different reports during the day, only use a handful of reports regularly, or want a quicker way to discover the reporting options available to you.
Open the Reports Dashboard
- Open the left-side navigation in Zanda.
- Select Reports.
- The Reports Dashboard opens and shows the reports available to you.
From there, you can browse by category, use search, star reports, or open a recently used report.
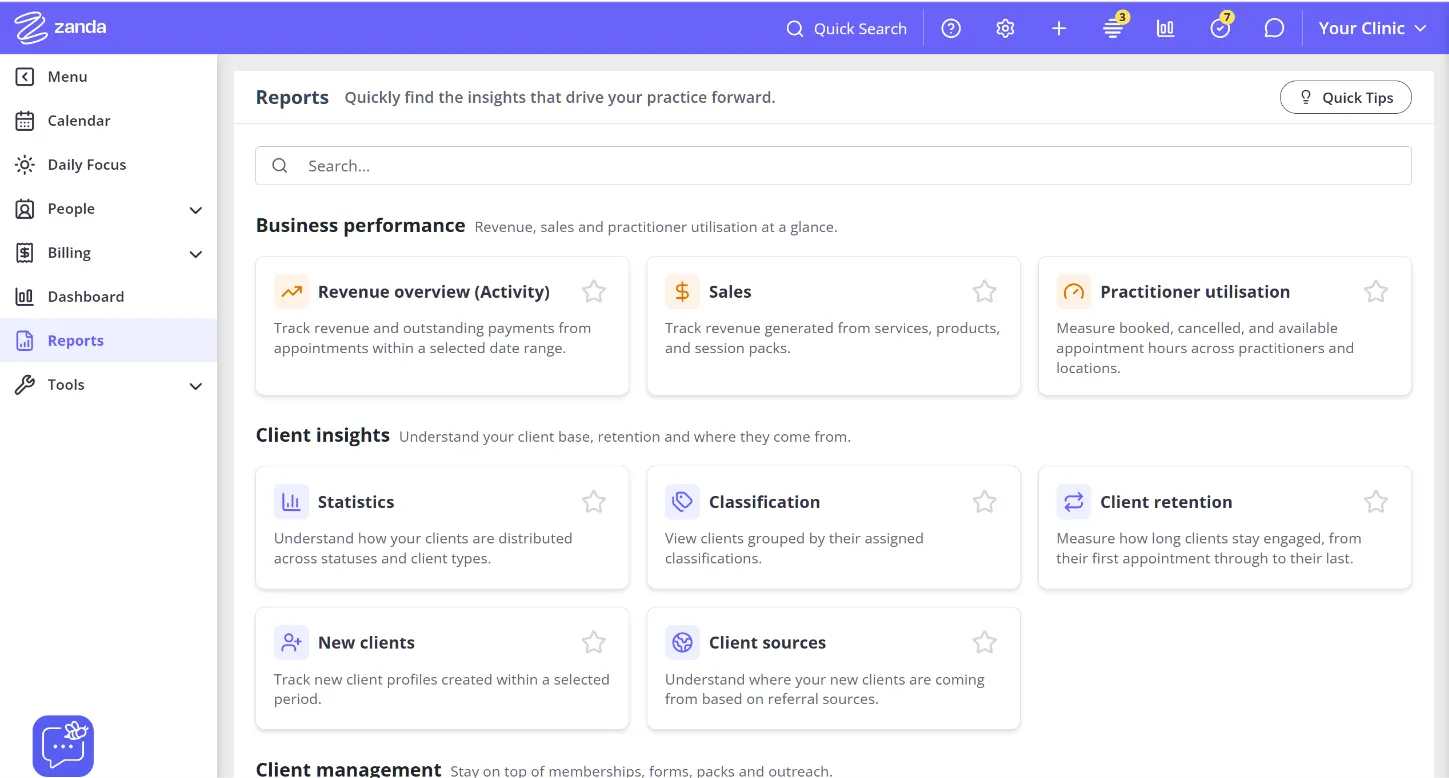
Browse reports by category
On the dashboard, reports are grouped into categories to make browsing easier. Only categories that contain reports available to you are shown. Categories include:
- Business performance
- Client insights
- Client management
- Scheduling
- Financial performance
- Marketing and referrals
- System usage and costs
To open a report, select its card. The report opens using its existing report page and behavior.
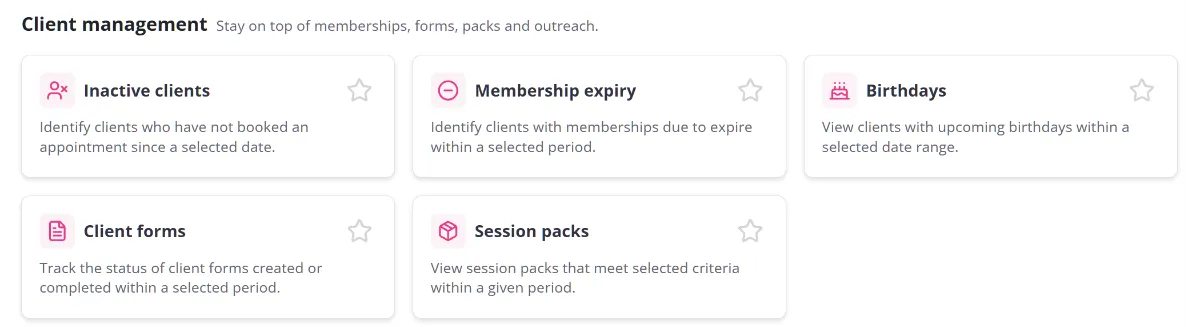
Search for a report
- Use the Search field at the top of the dashboard.
- Type part of a report name or description.
- Results update as you type.
- Select the report card you want to open.
Search checks report names and descriptions only; it does not search inside report results or report data. During a search, only matching reports are shown, and categories without matches are hidden. If no reports match your search, you see the message “No reports match your search,” and no report categories are displayed until you change or clear the search.
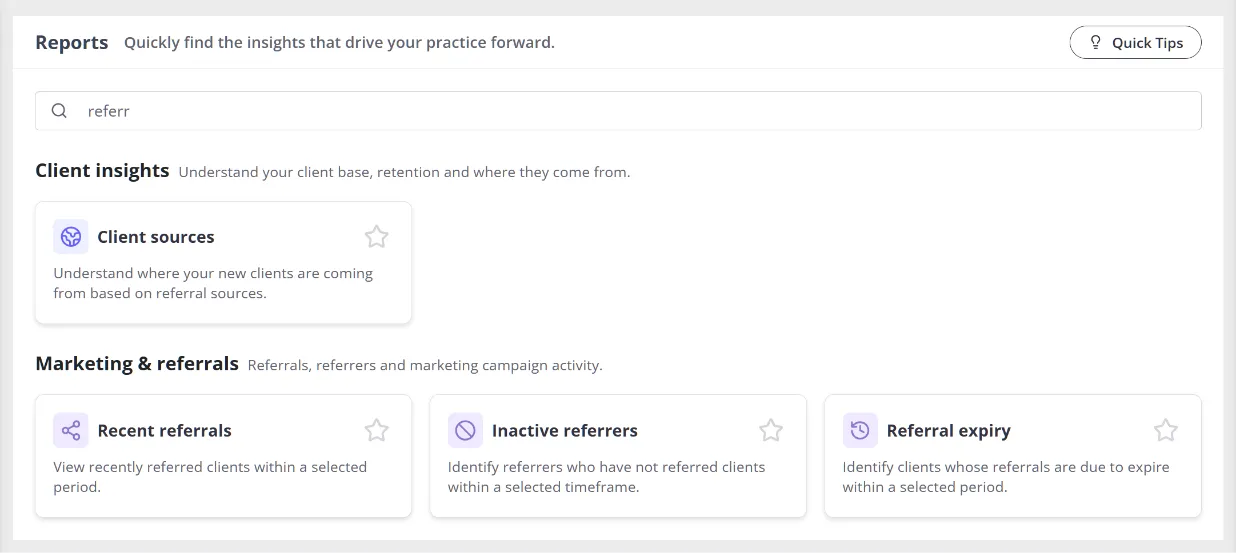
Star a report
- Find a report card on the dashboard.
- Select the star icon on the card.
- The report is added to your Starred section.
Starred reports are saved to your user account, so they stay available across sessions, browsers, and devices. If you star more than one report, they appear in the order you starred them.
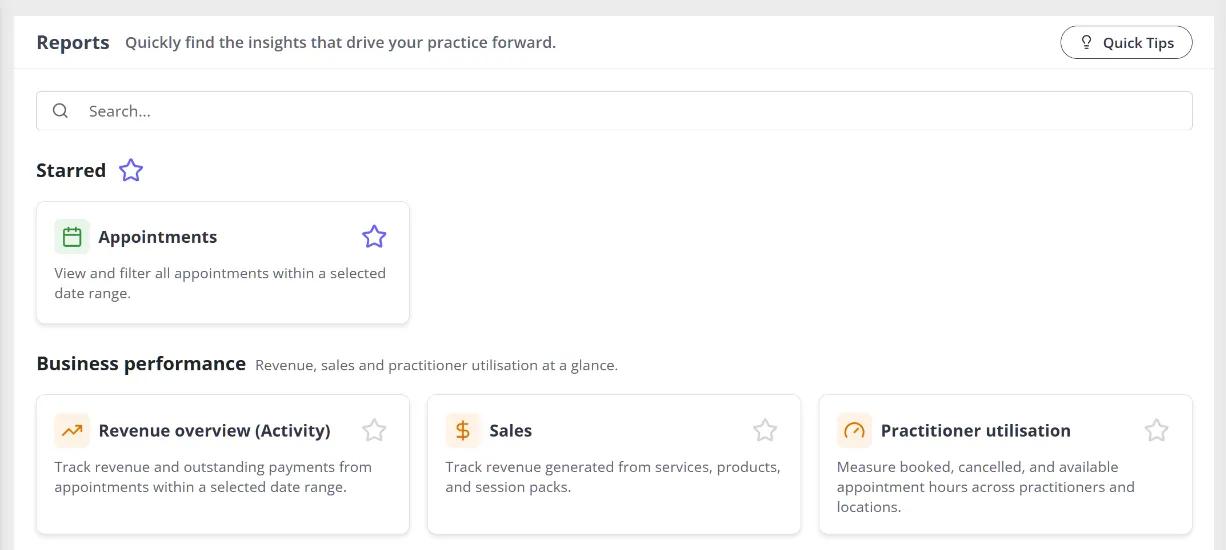
Unstar a report
You can unstar a report from either location:
- its original category card
- the card shown in the Starred section
When you unstar a report, it is removed from the Starred section but stays available in its original category. If you remove your last starred report, the Starred section disappears until you star another one.
Use the Recently used section
The Recently used section helps you reopen reports you accessed recently.
- Open a report from the dashboard.
- Return to the Reports Dashboard later.
- If you have recent reports, they appear in the Recently used section near the top of the page.
- Select a recent report card to open it again.
The dashboard keeps a history of up to eight recent reports and displays up to five of them on the page, ordered from most recent to least recent. Reports older than 30 days are automatically removed from your recently used list.
Recently used reports are stored in the browser you used. They are device- and browser-specific, so if you switch to another browser or computer, your recently used list starts separately there.
Note: Recently used reports are not synced across devices, unlike starred reports, which are saved to your user account and follow you everywhere you sign in.
Important notes and limitations
| Area | What to know |
|---|---|
| Access to reports | You only see reports that are available to you based on your permissions, account region, and applicable feature settings. |
| Starred reports | Starred reports are saved to your user account, so they persist across future sessions, browsers, and devices. |
| Recently used reports | Recently used reports are stored in the browser you used. They are device- and browser-specific and are not shared across other browsers or devices. |
| Recent history size | The dashboard keeps a history of up to eight recent reports and displays up to five of them on the page. |
| Recent history expiry | Reports older than 30 days are automatically removed from your recently used list. |
| Searching | Search checks report names and descriptions only. It does not search inside report results or report data. |
| Unavailable reports | If a report is no longer available to you, it does not appear on the dashboard, including in Starred or Recently used. |
Frequently Asked Questions
Why can’t I see a report that another user can see?
The Reports Dashboard only shows reports available to your user account. Access depends on your permissions, your account region, and whether a report is controlled by a feature setting.
What happens if I remove my last starred report?
The Starred section disappears when you no longer have any starred reports. It reappears as soon as you star another report.
I can’t find the Activity Report on the new dashboard. Where did it go?
It’s still there under a new name: Revenue overview (Activity), in the Business performance category. Opening the card takes you to the same report as before.
In summary
The Reports Dashboard makes reports easier to find and reuse. You can browse by category, search quickly, keep important reports starred, and return to recent reports without digging through navigation menus.
For everyday reporting, it is the fastest way to discover the reports available to you and get back to the ones you use most.